Topic: {PDF} Tablet Evaluation – Pharmaceutics Pharmaceutical Apparatus Material: Tablets are defined as solid unit dosage form of medicaments intended for oral use. They became most popular as they were easy in preparation compared to any other type of dosage forms. But the major drawback exists in its manufacturing. If any minor problem occurs during their manufacturing then the whole batch of the unit should be discarded. It is necessary to avoid any sort of errors during its manufacturing and as a result evaluation of tablets is very important before dispatching of a batch. In the present study, we discussed about the evaluation tests for tablets.
Tablet Evaluation:
Before a tablet is released out into the market it has to pass a few quality checks, which is mandatory. Evaluation of tablet includes the assessment of tablets physical, chemical and biological properties. To studies them the following test are formulated
- Appearance,
- • Size and Shape,
- • Organoleptic properties,
- • Uniformity of thickness,
- • Hardness,
- • Friability,
- • Drug Content Uniformity,
- • Weight Variation Test,
- • Wetting time,
- • Water Absorption Ratio,
- • In vitro Dispersion Time,
- • In vitro Disintegration Test,
- • In vitro Dissolution Studies,
- • Two set of apparatus,
Description:
Appearance:
Appearance is the first most required quality for the acceptance of tablet. General elegance and its identity play a major role for the consumer acceptance. Acceptance of the appearance of batches of the tablet has been done based on the measurement of the following factors like size, color, shape, presence or absence of odor, taste etc. [26-50]. Size and shape
General appearance is the physical appearance of the tablet it has two aspects to address
First one is the patient compliance, if the tablet is appearance is legible and good, it improves the patient compliance.
The second one Is for the manufacturer, it helps him in trouble free manufacturing if there is tablet to tablet, batch to batch and lot to lto uniformity of tablet.
General appearance would include a number of aspects like, size, shape, odor, taste, texture, legibility, identifying marks.
For rapid identification of the tablet and consumer acceptance the tablet are given a specific colour, the colour of the tablet will enable the manufacturer form differentiating the tablet lot.
The uniformity of the colour is important parameter here, the tablet should be free form mottling.
The colour uniformity and gloss of the tablet is evaluated by using reflectance spectrophotometer, tristimulus colorimetric measurement, microreflectance photometer.
Size and shape
Size and shape of a tablet has been determined by its thickness. Size and shape of a tables plays an important role in its patient compliance as the size of the tablet increases it is not much easier for its administration. Micrometer is the devise which is used to determine the thickness of a tablet. It can be acceptable if the batch falls within the ±5% of standard deviation.
Organoleptic properties:
Color should be distributed uniformly without appearance of any signs of mottling. Colour of the tablet should be compared with the standard colour for comparison.
Uniformity of thickness:
To determine the uniformity of thickness random selection of tablets has to be done from each and every batch and need to measure its thickness independently. If the thickness of any single tablet varies then the batch containing that batch will not be dispatched into market
WEIGHT VARIATION TEST
The weight variation test would be a satisfactory method for determining drug content uniformity of drug distribution. In practice this test is performed by taking 20 tablets, from a batch. 20 tablets are weighed at a time and the average weight is taken. Then the tablet is weighed individually.
| Average Weight |
Percentage Difference |
| 130 mg or less |
10 |
More than 130 mg through
324 mg |
7.5 |
| More than 324 mg |
5 |
2) THICKNESS AND DIAMETER (SIZE AND SHAPE)
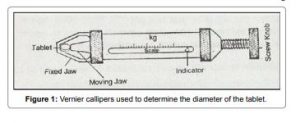
The thickness of individual tablets is measured with a micrometer, which gives us information about the variation between tablets. Tablet thickness should be within a ±5% variation of a standard value. Any variation in thickness within a particular lot of tablets or between manufacturer’s lots should not be clear to the unaided eye for consumer acceptance of the product. In addition, thickness should be controlled to smooth the progress of packaging.
Different shapes and sizes of tablet are available in the market they are manufactured in order to differentiate them based on their purpose of use and quantity of active ingredient, and the age group of the patient who is going to be administered with the drug.
Heart shape tablet signify that they are for the cardiac problems, small toy shape, tablet are manufactured in order to attract children etc.
The shape and size of a tablet would vary based on tooling used in the tablet manufacturing.
The prime consideration here would be the crown size, because if the concavity is very high it many lead to capping, or chipping problem.
The crown size is measured by using micrometer, and sliding caliper scale is used to measure the size of 5 to 10 tablets at a time.
We use Micrometer for tablet thickness
3) UNIQUE IDENTIFICATION MARK:
Pharmaceutical manufacturers in order to differentiate their product from the other manufacturers emboss a special marking g on the tablet. The marking can be an embossing, engraving or printing.
Apart from the company marking there can be imprints which include product code, product name, product potenct,
But care must be taken that the letters that are embossed on the tablet are properly printed without double impression.
5) HARDNESS AND FRIABILITY:
The hardness of the tablet is important for drug products that have bioavailability problem or that are sensitive to altered dissolution release profiles as a function of the compressive force employed. Tablet hardness is the force necessary to break the tablet diametrically. The tablets must be hard enough to withstand mechanical stress during packaging, shipment, and handling by the consumer.
Section <1216> of the USP 24/NF19 outlines a standard tablet friability test applicable to manufactured tablets. Most compounding pharmacy would not have the apparatus specified in Section <1216>. However, there are several hand operated tablet hardness testers that might be useful. Examples of devices are the Strong Cobb, Pfizer, and Stokes hardness testers. The principle of measurement involves subjecting the tablet to an increasing load until the tablet breaks or fractures. The load is applied along the radial axis of the tablet. Oral tablets normally have a hardness of 4 to 8 or 10 kg; however, hypodermic and chewable tablets are much softer (3 kg) and some sustained release tablets are much harder (10-20 kg).
Tablet hardness and strength are the essential to see that the tablet can with the shock and stress during manufacturing packing and transportation, and while handled by the patient.
To test the hardness of the tablet Monsanto tester, Strong-cobb tester, the Pfizer tester, the Erweka tester, the Schleuniger tester are used.
Hardness is sometimes termed the tablet crushing strength. To perform this test the tablets are located between two anvils and force is applied to the anvils, and the strength required to break the tablet is noted. If the tablet is too hard, the disintegration time is long and cannot meet up the dissolution specification, if its too soft, it cannot withstand handling when dealing with processes such as coating or packaging and shipping operations. The force with which the tablet is broken is expressed in kilograms and a hardness of 4Kg is usually well thought-out to be the minimum for satisfactory tablets. Oral tablets have a hardness of 4 to 10kg ; but, hypodermic and chewable tablets have a hardness of 3 kg and sustained release tablets have about 10-20 kg.
Pfzier hardness tester was used for measuring the hardness of the formulated Paracetamol tablets. From each batch 3 tablets were taken at random and subjected to test. The mean of these 3 tablets were calculated.
Friability is the tested for a tablet to see weather the tablet is stable to abrasion or not, it is tested by using Roche friabilator. This is made up of a plastic drum fixed with a machine which rotated at 25 rpm for 100 revolutions. And then the twenty tablets which were weighed prior to the test are taken out of the drum and cleaned with a cloth and weighed once again, the weight variation must not be less than 0.5 to 1.0% for an conventional tablet.
6) WEIGHT VARIATION:
Weight variation test is performed to check that the manufactured tablets have an uniform weight.
As per USP twenty tablets are weighed individually and an compendia weight is taken, the average weight is obtained by dividing the compendia weight by 20, now the average weight is compared to the individual weight of the tablet,
For a tablet to pass the test not more than 2 tablets should lie out of the specified percentage and if no tablet differs by more than two times the percentage limit.
Average weight
Maximum percentage difference allowed
WETTING TIME (Gohel et al., 2004)
A circular tissue paper of 10cm diameter were placed in a Petri dish having an internal diameter of 10 cm. 10 ml of water containing methylene blue (10% w/w) was added to the Petri dish. The tablet was carefully placed in the centre of the Petri dish and the time taken for the water to reach the upper surface of the tablets was known as wetting time.
7) DISINTEGRATION:
Disintegration is the first physical change observed for a drug when it enters into the body, thus to see simulate the disintegration of the tablet in the body the disintegration test is performed.
As per USP the disintegration apparatus consist of 6 glass tubes with a 10 number mesh at the bottom, each tube is 3 inch long.
This arrangement of 6 tubes is placed in a medium simulated to the disintegration environment. Which is maintained at 37oc +/- 2oc, in 1 liter vessel.
This system is made to move up and down through a distance of 5 to 6 cm at a frequency of 28 to 32 cycles per minute.
The disintegration time of the tablet is compared with the values in the monograph.
DRUG CONTENT (IP, 2007)
20 tablets were weighed and powdered. A quantity of powder containing 0.15 g of Paracetamol was added to 0.1 M NaOH, diluted with 100 ml of water. It was shaken for 15 minutes and sufficient water was added to produce 200 ml. 10 ml of the filtrate was diluted to 100 ml with water. Then 10 ml of the resulting solution was added to 10 ml of 0.1 M NaOH, finally diluted to 100 ml with water. The absorbance was measured at maximum of 257 nm. Calculate the content of C5H9N02 taking 715 as the value of A (1%, 1cm) at maximum at 257 nm.
8) DISSOLUTION:
Tablet dissolution: Disintegration time determination is a useful tool for production control, but disintegration of a tablet does not imply that the drug has dissolved. A tablet can have a rapid disintegration time yet be biologically unavailable. The dissolution rate of the drug from the primary particles of the tablet is the important factor in drug absorption and for many formulations is the rate-limiting step. Therefore, a dissolution time is more indicative of the availability of a drug from a tablet than the disintegration test. Even though this is an important parameter to measure, most pharmacies do not have the equipment needed to conduct these kinds of tests.
The rate and extent of drug release form the tablet is estimated by dissolution test
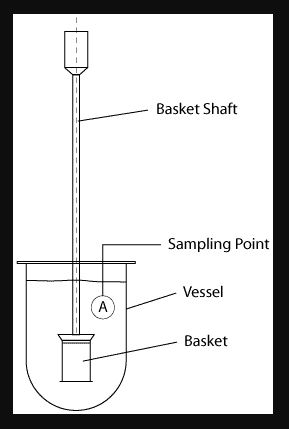
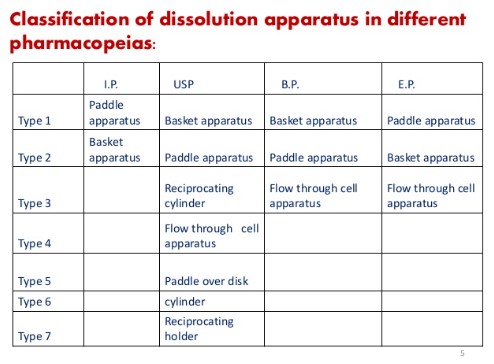
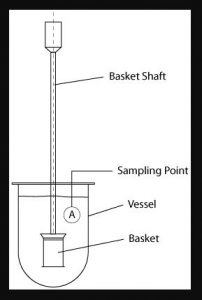
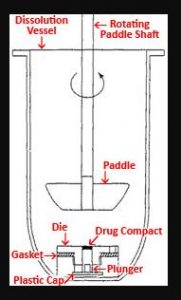
Different types of apparatus are used to study the dissolution test of the tablet. As per IP apparatus I (paddle) and apparatus II(basket) are used. called basket dissolution apparatus and paddle dissolution apparatus
But as per USP dissolution apparatus used are
USP 30 classification
i. Rotating Basket (Ph.Eur./BP/JP)
ii. Paddle (Ph.Eur./BP/JP)
iii. Reciprocating Cylinder (Ph.Eur.)
iv. Flow Through Cell (Ph.Eur./BP/JP)
v. Paddle Over Disk (Ph.Eur.)
vi. Rotating Cylinder (Ph.Eur.)
vii. Reciprocating Holder
- DISSOLUTION KINETICS (Higuchi WI, 1962)
Method used to compare dissolution data is:
- Model Dependent Methods (zero order, first order, Higuchi and Korsmeyer’s- Peppas).
Drug release kinetics
Drug release kinetics was studied from the datas obtained from in-vitro drug release studies which were plotted in various kinetics models: Zero order (equation 1) as Cumulative percentage of drug released against Time, First order (equation 2) as Log cumulative percentage of drug unreleased against Time, and Higuchi model (equation 3) as Cumulative percentage of drug released against Square root of time.
C = K0 t (equation 1)
where K0 indicates zero order rate constant expressed as concentration per time and t indicates the time in hours.
A graph of concentration against time gives a straight line with a slope equal to K0 and intercept the origin of the axis.
log C = log C0 – K t/2.303 (equation 2)
where C0 be the initial concentration of drug,
K be the first order constant, and t is the time.
Q = K t1/2 (equation 3)
where K indicates the constant of the system, t indicates the time in hours.
Drug release were plotted in Korsmeyer equation (equation 4) as Log cumulative percentage of drug released against Log time, and the exponent was calculated from the slope of the straight line.
Mt / Mα = K tn (equation 4)
where Mt / Mα is the fraction of solute release, t is the release time, K is the kinetic constant
The dissolution time and rate is compared to the values mentioned in the monograph.
In vitro disintegration test
Disintegration is defined as the process of breakdown of tablet into small particles. Disintegration time of a tablet is determined by using disintegration test apparatus as per IP specifications. Place each tablet in each 6 tubes of the disintegration apparatus a then add a disc to each tube containing 6.8 pH phosphate buffer. The temperature of the buffer should maintain at 37 ± 2°C and run the apparatus raised and lowered for 30 cycles per minute. Note down the time taken for the complete disintegration of the tablet without any remitants .
References
1. J. S. Swarbrick, Encyclopedia of Pharmaceutical Technology, Third dition – 6 Volume Set,
Taylor & Francis, 2006.
Lachman et al., 1990


